|
The INTERNATIONAL JOURNAL of APPLIED RESEARCH In Veterinary Medicine |
 |
| Current Issue |
| Previous Issues |
| Reprint Information |
| Back to The International Journal of Applied Research in Veterinary Medicine |
The Effects of Dietary
Molybdenum S ulfur
and Iron on Absorption of Three Organic Copper Sources
H. D. Ashmead
S. D. Ashmead
Albion Advanced Nutrition, Clearfield, Utah, U.S.A.
KEY WORDS: Molybdenum, copper, feed, steer, nutrition, veterinary.
Abstract
Twenty-seven Angus steers were fed identical diets for 120 days fortified with 10 mg copper (Cu)/kg feed from either Cu amino acid chelate, Cu proteinate, or Cu amino acid complex plus 750 mg Fe/kg feed, 0.35% S, and 10 mg Mo/kg feed, which are known Cu absorption/metabolism antagonists. Analysis of liver, blood serum and ceruloplasmin indicated that while all 3 sources of Cu were initially affected by the dietary antagonists, only the amino acid chelated source was able to overcome these effects and provide significantly more available Cu to the animals.
Introduction
When molybdenum intake exceeds 1 mg/kg of dry matter, a reduction in copper (Cu) absorption in the ruminant usually results.1,2 This antagonism is exacerbated by the presence of as little as 0.2% sulfur (S) as a sulfide ion. The Mo/S synergistic effect begins with the substitution of S for oxygen in the MoO42 ion to ultimately yield tetrathiomolybdate (MoS42):
MoO4 2 Æ MoO3S2 Æ MoO2S22 Æ MoOS32 Æ MoS42
MoS42 has the potential to bind ruminal Cu ions, rendering them nutritionally unavailable to the animal. When Mo intake exceeds 10 mg/kg of dry matter, the MoS42 formed may also interfere with Cu metabolism because of the formation of highly stable CuMoS4 molecules in the plasma (Figure 1).3,4
As little as 250 mg iron (Fe)/kg feed can reduce Cu reserves in ruminant tissues.1,5 While the exact inhibition mechanism is not completely elucidated, it is believed that ionic Fe and Cu may compete for the same luminal binding proteins necessary for mucosal transport with Fe being preferentially bound.68 The binding of Fe2+ with ruminal S2 may also result in an insoluble FeS compound. The S2 is donated by the Cu binding transport proteins in the mucosa which are rich in sulfhydryl groups. With the loss of S2, the formation of the mercaptide bonds necessary to complex potentially available Cu ions is blocked.9
Regardless of the exact mechanisms involved, the fact remains that when Mo, S, and Fe are included in the ruminant feed at minimum concentrations of 1 mg/kg, 0.2%, and 250 mg/kg, respectively, dietary ionic Cu absorption is reduced.
While chemically different, copper amino acid complex, copper proteinate, and copper amino acid chelate are usually grouped together as organic minerals and are frequently but erroneously thought of as having similar bioavailabilities. Copper amino acid complex is defined by the Association of American Feed Control Officials (AAFCO) as the product resulting from the complexing of a soluble copper salt with an amino acid.10 Cu proteinate is defined by AAFCO as the product resulting from the chelation of Cu ions to amino acids and/or partially hydrolyzed protein.10 AAFCO has defined Cu amino acid chelate as the chelation of ionic Cu to one to three amino acids, but unlike Cu proteinate, not to partially hydrolyzed protein.10 If Cu is chelated into either the proteinate or amino acid chelate molecule, the Cu must be bonded to the ligand at two sites by coordinate covalent bonds thus forming at least one heterocyclic ring. The strength of the Cu chelate and consequently the degree of potential Cu reactivity with other complexes in the rumen will vary with the size of the chelating ligand, the stereochemistry of the Cu chelate, the number of chelating ligands the ionic Cu is bonded to, the size of those chelate rings formed with the single Cu ion, and finally the basic strength of the chelating ligand.11
Cu proteinate, Cu amino acid complex, and Cu amino acid chelate are all reported to be more bioavailable than commonly fed Cu salts.12 In the case of either the complex or proteinate source of Cu, it is believed that the Cu is protected from some chemical reactions within the gastrointestinal tract, but their exact absorption mechanisms are unknown.13 Several studies suggest that the greater bioavailability of the copper amino acid chelate used in this study results from copper protection in the gut followed by absorption of the intact molecule into the mucosal cells where hydrolyzation subsequently occurs.7,14,15 If chelating or complexing Cu reduces its potential to react with ruminal anions, then depending on the stability of that chelate or complex, the anions that are antagonistic to dietary Cu may not have as great of an effect on Cu absorption from these sources. The purpose of this study was to determine if a Cu amino acid complex, a Cu proteinate source and/or a Cu amino acid chelate was capable of protecting the Cu and allowing its increased absorption in the presence of dietary Mo, S, and Fe antagonists.
Materials
and Methods
Twenty-seven Angus steers of similar age with a mean weight of 700 lbs (318 kg) were purchased from the same farm and each assigned a number which was recorded on each animals ear tag. Following acquisition, all of the animals were allowed to acclimate in a common pen for 14 days. Pelletized feeds were gradually introduced into their diets during acclimation in order to allow them to become accustomed to the pelleted form of treatments that would follow. At the conclusion of the adaptation period (following the procedure of Hickok et al.,16 which eliminates variability), a 0.5 g (net weight) liver biopsy was obtained from each animal using a Tru-Cut® biopsy needle (Cardinal Healthcare, McGraw Park, IL). Larry Hortsman, DVM, a faculty veterinarian at Purdue University who is experienced in taking bovine liver biopsies, collected all the samples during the study. The biopsies were removed from the caudal region of the liver between the 12th and the 13th rib, 20 cm ventral to the midline. The caudal region of the liver contains a higher amount of Cu than other portions of the liver.16
Each hepatic sample was washed with saline solution for 1 minute to remove excess blood, blotted, and placed in a special sealed container identified by the animals ear tag number. It was subsequently shipped cold by overnight delivery to a certified analytical laboratory (Albion Laboratories, Clearfield, Utah) where it was weighed both wet and dry. Each sample was then liquefied in a Waring blender and subsequently digested in concentrated nitric acid before being assayed for Cu, Fe, and Mo by a plasma emission spectrophotometer equipped with an ultrasonic nebulizer.17,18
Concurrent to taking liver biopsies, blood was obtained by venipuncture from each animal, spun, and the serum divided into two parts, both of which were put in individual vacutainers designed for serum storage. Each vacutainer was identified by the animals ear tag number. A 0.5 mL sample was sent to the same analytical laboratory that assayed the liver samples and was also assayed for Cu, Fe, and Mo using plasma emission spectrophotometry.18,19 The second 0.5 mL serum sample was sent to the laboratory of Robert DiSilvestro, PhD, Ohio State University, where that sample was assayed for ceruloplasmin activity.19
Both laboratories
and all personnel were kept blind as to which animals received which
feed supplements as described below. Each liver and serum sample was
identified only by the number which corresponded to the ear tag of the
animal donating the samples.
Based on these pretrial assays, the cattle were distributed into 3 pens of 9 steers each such that all initial Cu measurements were more statistically equivalent. The statistical blocking for pen assignment was based first on ceruloplasmin activity, second on serum Cu levels, and finally on hepatic Cu levels.
Each pen was color-coded and randomly assigned a corresponding color-coded treatment, described below. The color marking on the pen matched the color of the feed tag of one of 3 basal diets. The herdsman was blinded as to what the treatments contained, but simply fed each group the correct amount of pelleted basal diet from the bag with a feed tag color that matched the assigned color of the pen.
Except for the sources of Cu, all of the steers received the same basal diet. The basal diet was divided into 3 parts, identified as test pellet No. 1, test pellet No. 2, or test pellet No. 3. The basal diet contained 17% crude protein, 3% crude fat, 11% crude fiber, a maximum of 1.8% Ca, 0.62% P, 1.8% Na, and 1.2% K. The basal diet also contained Cu sulfate, ferrous sulfate, zinc sulfate, and sodium molybdate plus additional Cu in the form of the organic minerals described below. One treatment contained 10 mg/kg of supplemental Cu as Cu proteinate (Cu Bioplex®, Alltech, Nicholsville, KY); the second treatment contained 10 mg/kg of supplemental Cu as Cu amino acid complex (Cu Availamin®, Zinpro, Eden Prarie, MN); and the third treatment contained 10 mg/kg of supplemental Cu as Cu amino acid chelate (Cu MAAC®, Albion, Clearfield, UT).
Each source of Cu was thoroughly mixed with one third of the basal diet and then each of the fortified basal feeds was pelleted by Carl S. Akey, Inc. (Lewisburg, Ohio). Based on the total dry matter weight of the feed, each treatment was calculated to contained 10 mg Mo/kg feed (sodium molybdate), 0.25% S (from sulfates), and 500 mg Fe/kg feed (from sulfates). Prior to feeding, each basal diet was assayed by plasma emission spectrophotometry for Cu, Mo, S, and Fe.18, 19 The final analysis of each pelleted basal diet indicated that it contained 20 mg Cu/kg feed, 10 mg Mo/kg feed, 0.35% S, and 750 mg Fe/kg feed. Each pelleted basal diet containing a different source of Cu was identified by a different color feed tag that matched the assigned color of the pen, as described above, so that the correct basal diet was fed to the right group of animals.
The pelleted basal
diets were fed at the rate of 1.5 lbs (0.68 kg)/head/day. Additionally
the cattle were fed maize and free choice grass hay mixed with alfalfa
according to NRC recommendations at approximately the calculated levels
necessary to gain 3 lbs (1.36 kg)/day. All of the cattle were pen fed
morning and night and encouraged to eat at the same time. Maize and
hay intake were regulated to ensure complete consumption of the pelleted
basal diet.
Each of the animals received its assigned pelleted basal diet daily for 120 days. At 60, 90, and 120 days of treatment, liver biopsies and serum samples were obtained from each animal following the procedures employed at initiation of the study. The liver samples and half of the serum sample were assayed for Cu, Fe, and Mo. Ceruloplasmin activity was concurrently determined from the other half of the serum sample. At the conclusion of the trial at the time that the final liver and serum samples were obtained, each animal was weighed again.
All of the collected
data were analyzed statistically using Systat® Version 10 (Systat Software,
Inc., Richmond, CA). Analysis of covariance (ANCOVA) was performed on
the individual time periods which accounted for and normalized the differences
in the means of groups and showed significant changes in the studied
variables in relation to their initial or previous variable values.
Multivariate analysis of covariance (MANCOVA) was also performed for
overall experimental error and to detect differences in the responses
of the studied variables based on previous variable values. By using
MANCOVA to determine experimental error and power univariant, ANCOVA
could be performed without increasing experimental error.
Results
The combined effects of Mo, S, and Fe significantly affected Cu absorption in each group (p = 0.032) but these effects were greater in the animals fed Cu proteinate or Cu amino acid complex sources compared to those fed Cu amino acid chelate.
Table 1 presents the mean Cu, Fe, and Mo assays from the liver biopsies at the initial phase of the study and at 60 days, 90 days, and 120 days of treatment. Below the actual numbers are the same data expressed as percentages relative to the initial values. In the initial phase to 60 day period, all of the treatments responded to the dietary Cu antagonists (P < 0.001). As a percentage, by 90 days the livers in the animals fed Cu amino acid chelate (amino acid chelate group) contained significantly more Cu compared to either those fed the Cu proteinate (proteinate group) or Cu amino acid complex (amino acid complex group) (P < 0.005). The initial phase to 90 day declines in the proteinate and the amino acid complex groups were 29.7% and 15.5% greater, respectively, than the amino acid chelate group. From the initial phase to 120 days the decline in the Cu content of the liver was 29.17% more and 12.5% more for the proteinate and amino acid complex Cu sources compared to the amino acid chelate sources. The differences between the amino acid chelate and the proteinate or amino acid complex groups were significant (P < 0.05). There was also a significant period effect of the Cu antagonists on all of the groups from 90 days to 120 days compared to the 60 to 90 day period (P < 0.001).
Compared to the mean values at the commencement of the study to 120 days, the Fe liver level in the proteinate group declined the most (to 49% of initial). The amino acid chelate was next (to 64% of initial) followed by the amino acid complex (to 77% of initial). The decline in hepatic Fe in the proteinate group was significantly greater than either the amino acid complex or amino acid chelate group (P < 0.05).
There were no significant treatment or period effects on the liver Mo values in any of the groups.
The ceruloplasmin activity for the 3 groups of steers is presented in Table 2 with the same data being shown as percentages of the initial ceruloplasmin activity below the actual values. During the first 60 days of the study, there was a significant (P < 0.05) period effect on each of the groups but no significant treatment effect. The increased ceruloplasmin activity in the 3 groups from 60 to 90 days was not significant. There was a significant change from the 90 to 120 day period compared to the 60 to 90 day period for all groups (P < 0.001). For the entire 120-day study, the increase in the ceruloplasmin activity of the amino acid chelate group was significantly improved (p = 0.086). The increases in the ceruloplasmin activity in the proteinate and amino acid complex groups were not significant (P < 0.10).
Table 3 summarizes the mean quantities and changes in Cu, Fe, and Mo in the serum of the 3 groups of animals. The same data are expressed as a percentage relative to the initial measurements under the actual values. There was no significant treatment effect on Cu serum values between the initial phase and 60 days for any of the groups, but there was a significant period effect on the Cu serum level of the proteinate group (P < 0.03). From 60 to 90 days there were significant treatment changes on serum Cu in all 3 groups (P < 0.05). There were also significant changes (P < 0.001) in the Cu serum values in all groups. There were significant differences between the amino acid chelate group and the other 2 groups (P < 0.08). At 90 to 120 days, there was a significant (P < 0.08) increase in Cu serum levels for the amino acid chelate group, whereas neither the proteinate nor the amino acid complex group had significant increases in Cu serum levels.
For the Fe serum values from the initial phase to 120 days, the proteinate group increased 15.85%, the amino acid complex group 19.19%, and the amino acid chelate group 26.49%. There was a significant treatment difference between the 3 groups (P = 0.03) at the 60 day sampling period, but by 90 days and beyond, there were no significant differences in serum Fe.
In the case of the Mo serum values, the proteinate group increased from the initial phase to 60 days and then dropped from 90 days to 120 days for a total increase from the initial phase to 120-day increase of 407%. The mean Mo serum level of the amino acid complex group peaked at 60 days and then decreased. The total increase was 473% which was significantly greater (P < 0.10) than when the study commenced. The mean serum Mo level in the amino acid chelate group increased from the initial phase to 60 days, decreased from 60 to 90 days, and then increased from 90 to 120 days. The total increase over the study period was 375%. The differences in these percentage increases in each of the groups from initiation of the study to 120 days were significant (P < 0.05).
The mean weight gain per animal per day was 2.5 lbs (1.14 kg). The weight gains between the groups were not significantly different.
Discussion
Given the combined effect of the Cu antagonists in the experimental diets, the levels of Cu administered were probably either too low or the levels of inclusion of the antagonists too high to produce optimum Cu bioavailability data. While bioavailability of all 3 sources of Cu appeared to be affected by the total amounts of Mo, S, and Fe in the diet, this study indicated that there are significant differences in the degree of Cu suppression depending on the source of supplemental Cu. Since each manufacturer of the Cu sources claims to produce its product differently, the differences seen in this study possibly originate in those manufacturing methods.
Despite the observed differences in the cattles responses to the three sources of organic Cu, a future study should consider either increasing the Cu levels in each group or reducing the levels of the Cu antagonists. A greater biological response to the Cu supplements would have probably resulted if either of these changes had been made.
Based on previous observations, the combined effect of Mo, S, and Fe on Cu absorption and metabolism was fairly predictable.16 Nevertheless, a future study should perhaps include a control group of animals that received no supplemental Cu.
Initially, the Cu proteinate appeared to be the most strongly affected by the antagonists, suggesting a possibility of a greater ruminal hydrolyzation of the molecule and subsequent Cu ionization due to low chelate stability. While there was slightly more hepatic Cu in this group at study initiation, as a function of both time and treatment, it declined the greatest suggesting the potential for further decline had the study continued past the 120 days. Cu is delivered to the liver via the serum, and the final serum Cu of the proteinate group was significantly less than that of the amino acid chelate group. Since the liver is responsible for the production of ceruloplasmin using serum-delivered Cu, one explanation for the lower ceruloplasmin activity of the proteinate group is lower Cu serum values and larger hepatic Cu level decline compared to the amino acid chelate group. This suggests that the dietary Cu antagonists had a greater effect on the proteinate source.
The Cu amino acid complex group had numerically higher Cu liver, serum, and ceruloplasmin values than the Cu proteinate, but all of these measurements were not statistically different. This suggests that the dietary Cu antagonists introduced into the feed of the group receiving the amino acid complex had about the same effect on this groups Cu status as the antagonists had on the group fed with the Cu proteinate. This leads to the conclusion that
Cu proteinate and
Cu amino acid complex may be equivalent sources of dietary Cu.
The Cu amino acid chelate was the only supplemental source of Cu that demonstrated significant resistance to the Cu antagonists. The amino acid chelate group had the least total decline in hepatic Cu, thus suggesting that more Cu from the amino acid chelate was absorbed and metabolized than from either the proteinate or complex groups. Additional absorption studies are indicated to determine the exact percentage absorbed or inhibited.
The amino acid chelate group was the only group showing a significant increase in ceruloplasmin activity from initiation to 120 days, suggesting that, as Cu antagonists built up in the body over time, only the Cu amino acid chelate source was able to overcome these deleterious effects. The data suggest that more Cu was transported to the tissues from the amino acid chelate source compared to either the Cu proteinate or Cu amino acid complex sources. These observations are borne out by the significantly higher serum Cu levels at 90 to 120 days in the amino acid chelate group. It is interesting to note that, following the initial decline in Cu status of the amino acid chelate group, it commenced correcting itself after the 60-day period. Statistically, neither the proteinate group nor the amino acid complex group followed the same pattern. Had the experiment not been terminated at 120 days, a more normal Cu status may have ultimately resulted in the amino acid chelate group. This perhaps should be the subject of an additional longer-term study.
There was a smaller increase in the Mo serum levels of the amino acid chelate group compared to the proteinate and amino acid complex groups. The potential effects of Mo on Cu levels in the blood are summarized in Figure 1. Absorbed MoS42 can either increase the binding capacity of the ceruloplasmin and reduce tissue levels of Cu, or it can directly bind with plasma Cu and reduce ceruloplasmin activity. Because of the total increases in ceruloplasmin activity in all 3 groups coupled with reduced hepatic Cu level, the absorbed Mo appeared to influence the binding capacity of the ceruloplasmin. The amino acid chelate group appeared to be the least affected suggesting some of the copper may have remained chelated to the original amino acids even after absorption. If that were the case, it would confirm certain other absorption studies.7 This possibility needs further investigation.
It is also possible that the increased serum Mo complexed more serum Cu resulting in decreased ceruloplasmin activity in both the proteinate and amino acid complex groups compared to the amino acid chelate group. If that were the case, it would suggest that at least some of the amino acid chelate derived Cu arrived in the blood in a more stable (less reactive) form than either the proteinate or amino acid complex sources of Cu. These observations indicate the need for more studies.
Why more Mo was absorbed by the proteinate and amino acid complex groups compared to the amino acid chelate group is unknown and should also perhaps be the subject of further study. All 3 groups of steers had less hepatic Fe at the conclusion of the study compared to commencement levels. This is surprising since supplemental Fe was fed. In view of the serum Fe increases, perhaps Fe secretion occurred. Another explanation may be that iron ions are bonding with the sulfhydryl groups on the Cu transport proteins to form insoluble complexes, thus reducing the actual absorption of both Fe and Cu. A third possibility is that the dietary Fe was poorly absorbed for some other reason, causing increased mobilization of liver Fe. More research would be required to elucidate these observations.
A future study should perhaps consider which source of organic Cu was able to most rapidly restore Cu status to the Cu depleted steers. A future study should also incorporate other research parameters that would provide additional and more definitive data on the effects of the different Cu sources on cattle.
Finally, the daily weight gains were not as great as the formulated diet projected. Perhaps this was due to inadequate available Cu to support necessary growth and underscores the importance of available Cu in the diet of growing cattle. Another explanation lies in the research design. It was more important to limit the quantity of free choice feed to ensure that the cattle would consume all of the basal diets containing the treatments than it was to optimize gain. In managing feed consumption, gain potential may have been affected.
Conclusions
Although none of the 3 organic sources of Cu could
maintain the pre-trial Cu tissue and serum values, there were significant
differences in metabolic responses based the Cu source. The amino acid
chelate source of Cu appeared to overcome effects of the Cu antagonists
more effectively than either the Cu proteinate or the Cu amino acid
complex and provided more available Cu to the animals. Based on this
study, it was concluded that Cu amino acid chelate was more bioavailable
than either the Cu proteinate or Cu amino acid complex and thus produced
a significantly greater positive metabolic response.
References
1. Suttle NF, Field AC: Effects of dietary supplements of thiomolybdates on copper and molybdenum metabolism in sheep J Comp Path 93:379389, 1983.
2. Suttle NF, Abrahams P, Thornton I: The role of a soil x dietary sulphur interaction in the impairment of copper absorption by ingested soil in sheep. J Agri Sci Camb 103: 8186, 1984.
3. Mills CF: Metabolic interactions of copper with other trace elements in Mills CF, ed. Biological Roles of Copper. Amsterdam: Excerpta Medica; 46, 1980.
4. Mills CF,
Bremner I, El-Gallad TT, et al: Mechanisms of the Mo/sulphur antagonism
of copper utilization by ruminants in Kirchgessner, M, ed. Trace Elements
in Man and Animals 3 Freising: Institut Für Ernährungsphysiologie;
150158, 1978.
5. Humphries WR, Phillipo M, Young BW, Bremner I: The influence of dietary Fe and Mo on copper metabolism in calves. Br J Nutr 49:7786, 1983.
6. Suttle NF, Peter DW: Rumen sulphide metabolism as a major determinant of copper availability in the diets of sheep. in Mills CF, Bremner I, Chesters JK, eds: Trace Elements in Man and Animals 5 Farnham: Royal Slough Commonwealth Agricultural Bureau; 367370, 1985.
7. Ashmead HD, Graff DJ, Ashmead HH: Intestinal Absorption of Metal Ions and Chelates. Springfield: Charles C. Thomas; 71102, 1985.
8. Ashmead H: Tissue transportation of organic trace minerals. J Appl Nutr 22:4251, 1970.
9. Mason K: A conspectus of research on copper metabolism and requirements of man. J Nutr 109:1990, 1979.
10. Bachman PM, ed: Official Publication Association of American Feed Control Officials Incorporated Oxford: AAFCO; 278, 2003.
11. Kratzer FH, Vohra P: Chelates in Nutrition. Boca
Raton: CRC Press; 527, 1986.
12. Power R, Horgan K: Biological chemistry and absorption of inorganic and organic trace metals. Feed Compounder 21:2531, 2001.
13. Wapnir R: Protein Nutrition and Mineral Absorption. Boca Raton: CRC Press; 1990.
14. Bovell-Benjamin AC, Viteri F, Allen LH: Fe absorption from ferrous bisglycinate and ferric trisglycinate in whole maize is regulated by Fe status. Am J Clin Nutr 71:156315699, 2000.
15. Ashmead HD: The absorption and metabolism of iron amino acid chelate. Arc Lat Am J Nutr 51(Supp 1):13, 2001.
16. Hickok D, Carlson M, Brink D, et al: Multi-elemental analysis of bovine liver biopsy and whole liver. in Brink D, ed: University of Nebraska 1996 Beef Cattle Report. Lincoln: University of Nebraska; 1996.
17. USEPA: Test methods for evaluating solid waste: physical/chemical methods; Final Update III Method. 3050B, USEPA SW-846, 1997.
18. USEPA: Test methods for evaluating solid waste: physical/chemical methods; Final Update III Method 6010B, USEPA SW-846 , 1997.
19.
Rice E: Standardization of ceruloplasmin activity in terms of
International Enzyme Units. Anal Biochem 3:452456, 1962.
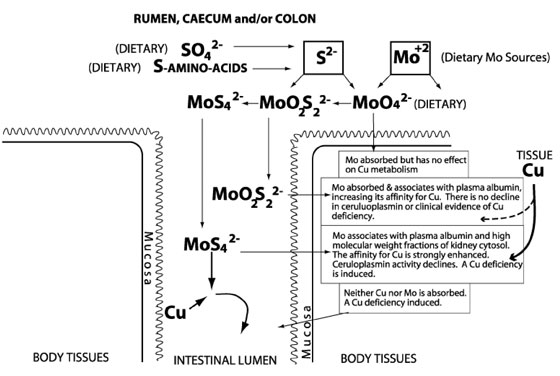
Figure 1. The
effect of Mo and S complexes on Cu absorption and metabolism. Reprinted
from Mills;3 with permission.
Table
1. Mean Cu, Fe, and Mo Contents
of Liver
Group Initial 60 Days 90 Days 120 Days
Copper Proteinate 208.33 ± 83.472 82.30 ± 46.67* 49.11 ± 24.31 35.59
± 19.73
100.0% 39.5% 23.6%
17.5%
Amino acid complex 205.56 ± 40.09 87.81 ± 27.99* 54.59 ± 20.83 43.66 ± 20.67
100.0% 42.7% 26.5%
21.5%
Amino acid chelate 174.34 ± 54.18 62.59 ± 26.64* 53.38 ± 26.08 41.32 ± 24.35§
100.0% 35.9% 30.6% 23.7%
Iron
Proteinate 435.22 ± 182.0 329.00 ± 161.49
222.78 ± 69.00 212.44
± 38.10
100.0% 75.6% 51.1%
48.8%
Amino acid complex 321.44 ± 87.62 197.38 ± 47.74 198.56 ± 57.23 247.89 ± 123.79§
100.0% 61.4% 61.7%
77.1%
Amino acid chelate 328.11 ± 91.00 236.63 ± 99.19 227.78 ± 63.68
208.67 ± 39.9§
100.0% 71.9% 69.4%
763.5%
Molybdenum
Proteinate 3.04 ± 2.07 4.67 ± 1.52 4.11 ± 1.19 2.91 ± 0.63
100.0% 153.0% 135.0% 95.7%
Amino acid complex 3.03 ± 0.58 4.23 ± 1.17 4.39
± 0.79 3.46 ± 0.98
100.0% 139.0% 145.0% 114.0%
Amino acid chelate 2.89 ± 0.45 3.71 ± 0.88 4.72
± 0.64 3.46 ± 0.30
100.0% 128.0% 163.0% 120.0%
*Significant difference (P < 0.001) between initial and 60 days
Significant period effect (P < 0.001) in changes between 60 and 90 days and 90 and 120 days
Significant difference (P < 0.005) in decline from initial to 90 days between treatments
§Significant
difference (P < 0.05) in
decline from initial to 120 day between treatments
Table
2. Mean
Ceruloplasmin Activity
Group Initial 60 Days 90 Days 120 Days
Proteinate 42.22 100.0% 46.22* 109.0% 48.11 114.0% 52.67 124.0%
Amino acid complex 42.44 100.0% 47.78* 113.0% 60.44 142.0% 58.11 137.0%
Amino acid chelate 42.44 100.0% 51.67* 122.0% 49.78 117.0% 61.44 144.0%
* Significant period effect (P < 0.05) between initial and 60 days
Significant period effect (P < 0.01) in changes from 60 to 90 days and 90 to 120 days
Significant treatment effect (P < 0.086) from initial to 120 days
Table
3. Mean Changes in Cu, Fe, and
Mo in Serum
Group Initial 60 Days 90 Days 120 Days
Copper Proteinate 0.84
0.63* 0.61
0.60
100.0% 75.0% 72.6%
71.4%
Amino acid complex 0.76 0.67
0.66v
0.70
100.0% 88.0% 86.8% 92.1
Amino acid chelate 0.84 0.73
0.63
0.74§
100.0% 86.9% 75.0% 88.1%
Iron
Proteinate 1.83 2.51§ 2.41 2.12
100.0% 137.1% 131.7% 115.8%
Amino acid complex 1.72 2.83§ 2.10 2.05
100.0% 164.5% 122.1% 119.1%
Amino acid chelate 1.51 2.35
2.23 1.91
100.0% 155.6% 147.7% 126.5%
Molybdenum
Proteinate 0.014 0.166 0.067 0.057**
100.0% 118.5% 478.0% 407.0%
Amino acid complex 0.015 0.155
0.067 0.071**
100.0% 103.3% 446.0% 473.0%
Amino acid chelate 0.016 0.054
0.053 0.060**
100.0% 33.7% 331.0% 375.0%
*Significant period effect (P < 0.05) from initial to 60 days
Significant treatment effect (P < 0.05) in change from initial to 60 days
Significant period effect (P < 0.001) from 60 to 90 days
§Significant treatment effect (P < 0.08) from 90 to 120 days
¶ Significant treatment effect (P < 0.05) between groups at 60 days
** Significant increase (P < 0.05) between groups from initial to 120 days
ISSN# 1542-2666